A Complete Guide to CRM Systems and Database Management
 Jeremy Wayne Howell : Jul 22, 2026 9:48:31 PM
Conversion rate optimization is the systematic process of understanding why website visitors don’t convert, then removing the psychological and practical barriers that prevent them from taking action.
What You Need to Know:
You’ve probably tried CRO before. Maybe you changed a button color because someone said it would work. Or you ran an A/B test on a headline. Perhaps you hired an agency that promised “proven strategies” but delivered mediocre results.
Here’s what you likely finded: random changes produce random results.
The conversion rate optimization industry has a dirty secret. Most practitioners treat it like a guessing game — test this, try that, see what sticks. They focus on tactics (what to change) instead of psychology (why people don’t convert). They chase industry benchmarks that don’t apply to your business. They run tests without understanding the underlying human behavior that drives decisions.
This creates a cycle of wasted time, lost revenue, and growing skepticism about whether CRO actually works.
The truth is simpler and harder: CRO works when you understand why your visitors aren’t converting before you decide what to test.
Every visitor arrives with specific needs, anxieties, and decision-making patterns. They’re not just traffic. They’re people trying to solve problems, comparing options, and looking for reasons to trust you. When conversions don’t happen, it’s because something in that psychological journey broke down.
Maybe they couldn’t quickly understand what you offer. Maybe they didn’t trust you enough. Maybe the next step felt too risky or too complicated. Maybe your message didn’t match their expectations. These are behavioral problems, not design problems.
This guide reframes conversion rate optimization from a tactical exercise into a diagnostic process. You’ll learn how to identify what’s actually stopping conversions, form hypotheses based on human psychology, and build a systematic approach that produces predictable growth.
Because the goal isn’t just a higher percentage. It’s a website that consistently turns skeptical visitors into confident customers — without burning through more budget, more tactics, or more trust.
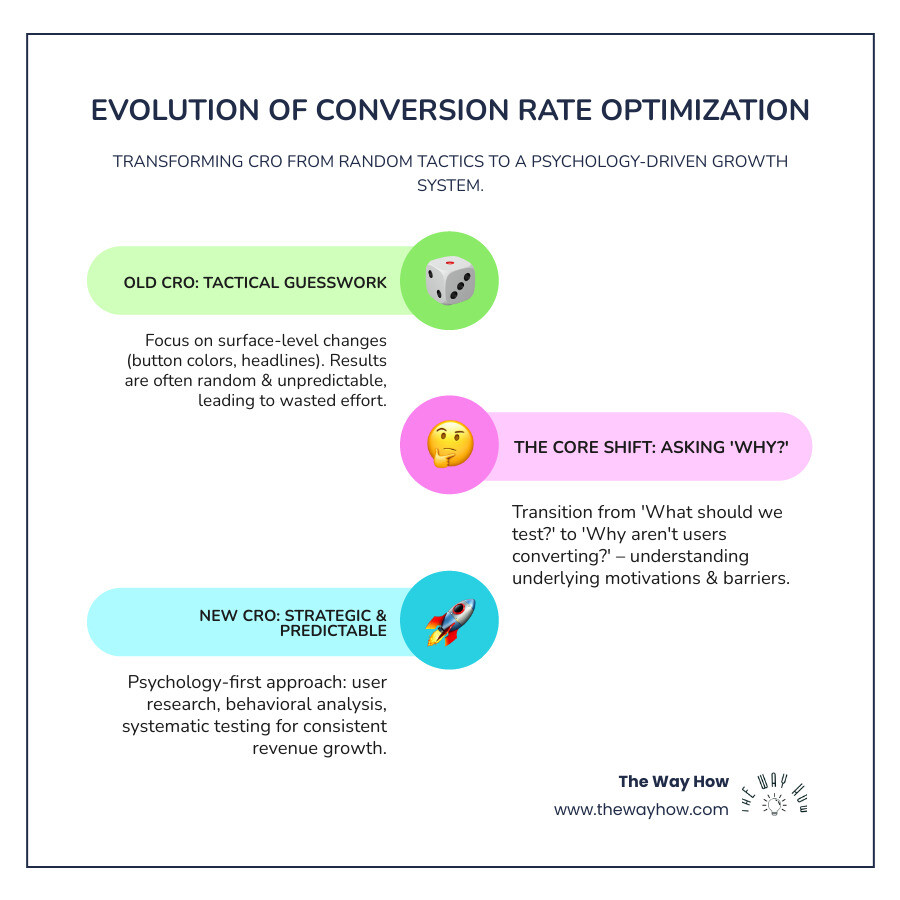
At The Way How, we believe that true conversion rate optimization isn’t about chasing fleeting trends or applying generic “best practices.” It’s about understanding the human beings interacting with your website. This means moving beyond the “what” (what visitors do) to the “why” (why they do it, or why they don’t). This psychology-first approach is central to building systems that create trust, momentum, and predictable revenue.
This perspective aligns with the foundational understanding of CRO as “The Art and Science of Converting Prospects to Customers” from early pioneers in the field. Conversion Optimization: The Art and Science of Converting Prospects to Customers.

Before we can optimize, we need to know what we’re optimizing for. Your conversion rate is simply the percentage of website visitors who complete a desired action.
How is conversion rate calculated? The formula is straightforward: Conversion Rate = (Total Number of Conversions ÷ Total Number of Visitors) × 100
For example, if your website receives 200 visitors in a day and 30 of them sign up for your email newsletter, your conversion rate for that specific action is (30 ÷ 200) × 100 = 15%.
It’s crucial to define what constitutes a “conversion” for your business. These can be categorized into:
What’s a good conversion rate? This is a common question, but as one source points out, the “average” conversion rate is often meaningless. While the e-commerce average conversion rate is around 3.3%, new e-commerce stores might initially see 1-2%, and service-based e-commerce can be closer to 9%. The average across fourteen different industries in 2023 was 2.9%.
Instead of fixating on these broad averages, we encourage you to focus on internal benchmarks and continuous improvement. Your “good” conversion rate is simply better than what you had before.
Every conversion is the result of a psychological journey. Our job in conversion rate optimization is to facilitate that journey by understanding three key elements:
User Drivers (Needs & Goals): What brings visitors to your site in the first place? What problems are they trying to solve? What aspirations do they have? Understanding these drivers helps us craft messages that resonate. This is about ensuring “message matching”—the context that triggers a visit (e.g., an ad or search query) aligns perfectly with what they find on your site. If an ad promises a business plan in 15 minutes, your landing page better deliver on that promise immediately.
User Barriers (Friction & Anxiety): What stops them from converting? These are the psychological and practical obstacles.
Building trust is paramount. Without it, visitors won’t overcome their anxieties. Transparency, social proof, and excellent user experience are the bedrock of trust.
Random changes lead to random results. At The Way How, we advocate for a diagnostic framework—a systematic, repeatable process that moves beyond guesswork to build a dependable growth engine. This framework helps us identify what’s truly stopping conversions, form hypotheses grounded in human psychology, and implement changes with confidence.
This systematic approach is critical because, historically, conversion rate optimization emerged from the need for e-commerce marketers to improve website performance after the dot-com bubble. The availability of website analysis tools in the early 2000s, like Google Website Optimizer (introduced in 2007), allowed marketers to experiment methodically.
Before we even think about solutions, we must first understand the problem. This involves gathering both quantitative and qualitative data to paint a complete picture of user behavior.
| Data Type | What it Tells You | How to Gather It |
|---|---|---|
| Quantitative Data (The “What”): Measures behavior via numerical data. | Qualitative Data (The “Why”): Explores the reasoning behind human behavior and decision-making. | |
| - Website Analytics (Google Analytics) | - Heatmaps & Session Replays | |
| - Conversion Funnel Analysis | - Surveys & User Interviews | |
| - A/B Test Results & Metrics | - Customer Support Logs | |
| - Page Load Speed Metrics | - Competitor Analysis (UX/UI) | |
| - Mobile Responsiveness Scores | - Usability Testing |
Our first step is to dive into your analytics data. Tools like Google Analytics allow us to track key metrics and identify where users are dropping off in their journey. This includes:
Numbers tell us what is happening, but they don’t tell us why. For that, we turn to qualitative data.
By combining these quantitative and qualitative insights, we can move from mere observation to genuine understanding of user psychology.
Once we’ve gathered our behavioral intelligence, it’s time to form a hypothesis. This isn’t a random guess; it’s an educated prediction based on the data we’ve collected. A strong hypothesis links an observed problem to a proposed solution, rooted in an understanding of user motivation.
A simple framework for a psychology-based hypothesis is:
“Because we saw [Data/Observation], we believe that [Change based on user psychology] will cause [Desired Impact/Conversion Increase].”
For example:
This approach ensures that our tests are purposeful and directly address identified behavioral barriers, rather than blindly changing elements.
With a well-formed hypothesis, the next step is to test it. This is where methods like A/B testing and multivariate testing come into play.
Statistical Significance: It’s vital to run tests until they achieve statistical significance. This ensures that your results are not due to chance, but are truly indicative of a winning variation. One study noted that only 12% of experiments actually produce a winning result. This isn’t a failure, though; it’s a learning opportunity. Each test, whether it “wins” or “loses,” provides valuable insights into what resonates (or doesn’t) with your audience. As we say, the only way optimization efforts ‘fail’ is if you fail to learn from them.
Prioritization Frameworks: To decide which hypotheses to test first, we often use frameworks like PIE (Potential, Importance, Ease) or ICE (Impact, Confidence, Ease). This helps us focus our efforts on changes that have the highest potential impact, are most confidently supported by data, and are easiest to implement.
Different parts of your website serve different psychological purposes in the customer journey. Therefore, our conversion rate optimization strategies must be custom to each area, always keeping user behavior and decision-making psychology at the forefront.
Your homepage is often the first impression a visitor has of your brand, and research suggests it takes just 50 milliseconds for that impression to form. This isn’t just about aesthetics; it’s about rapidly conveying clarity and building initial trust.
These pages are where visitors evaluate your offerings in detail. The goal is to build desire for your product or service while systematically addressing any potential hesitations.
The checkout process and submission forms are often the final hurdle to conversion. Our primary goal here is to reduce friction and maintain the momentum built on previous pages.
Reducing Friction: Minimize the number of steps and form fields required. The longer and more complex a form, the higher the abandonment rate. Consider breaking long forms into multiple, shorter steps.
Guest Checkout Options: Don’t force users to create an account immediately. Offering guest checkout can significantly reduce cart abandonment, especially for first-time buyers.
Security Signals: Display security badges (e.g., SSL certificates, trusted payment provider logos) prominently on checkout pages to alleviate anxiety about data privacy.
Overcoming Cart Abandonment: This is a huge challenge, especially on mobile, where as many as 85% of mobile shoppers will leave your site without checking out.
By carefully optimizing these critical areas, we systematically remove barriers and guide users toward conversion with empathy and clarity.
While we’ve touched on this, it’s worth reiterating: a “good” conversion rate is highly contextual. As our research indicates, the average e-commerce conversion rate for orders is often said to be between 2.5% and 3%. A 2023 survey found the average across fourteen industries to be 2.9%. Service-based e-commerce can see rates closer to 9%.
However, these numbers are often meaningless without context. Every website, industry, audience, and conversion goal is unique. Instead of chasing an arbitrary industry average, we recommend benchmarking against your own historical performance. Focus on incremental improvements month-over-month. If you increase your conversion rate from 1% to 2%, you’ve effectively doubled your leads or sales without spending more on traffic. That’s a significant win, regardless of what the “average” is.
This is a common question, and it highlights a crucial distinction in digital marketing:
While distinct, SEO and CRO are highly symbiotic. A strong CRO strategy can actually improve your SEO, and vice-versa:
The key is to balance keyword optimization with user experience. Don’t stuff keywords to the detriment of readability, but integrate them naturally into high-quality content that provides value to your visitors.
Don’t let a limited budget deter you from conversion rate optimization. Many powerful CRO activities can be initiated with minimal or no direct cost, focusing on leveraging existing resources and smart diagnostics.
Here’s how to get started:
Leverage Free Analytics Tools:
Focus on High-Impact Pages First:
Conduct Qualitative Research:
Start Small with A/B Testing:
The cost of not optimizing, even with a limited budget, is far greater than the effort required to start. Every visitor who leaves without converting represents a missed opportunity and a potential waste of your marketing spend.
Conversion rate optimization is not a magic bullet or a series of isolated tricks. It’s a fundamental shift in how you approach your online presence. At The Way How, we see it as a continuous diagnostic process, rooted in understanding human behavior, empathy, and decision-making psychology.
By systematically identifying the psychological drivers, barriers, and hooks that influence your audience, you move beyond surface-level tactics. You begin to diagnose why growth is stalled, pinpoint certainty gaps in the customer journey, and design systems that create trust, momentum, and predictable revenue.
This playbook is your guide to turning your website from a passive brochure into an active growth engine. It’s about empowering your business to convert skeptical visitors into confident customers, consistently and predictably.
Ready to build a system that delivers predictable growth? Learn how our services can build your growth system.
 Jeremy Wayne Howell : Jul 22, 2026 9:48:31 PM
 Jeremy Wayne Howell : Jul 21, 2026 9:47:10 PM
 Jeremy Wayne Howell : Jul 20, 2026 9:46:47 PM